WNBA team stats leaders in 2026 are defined by four numbers: offensive rating, defensive rating, net rating and pace. This page lays out what each one measures, which direction wins, and how to read the leaderboard without getting fooled by per-game totals.
- Net rating is the WNBA team stat that best separates 2026 contenders from pretenders.
- Points per game misleads: fast teams pile up points without scoring efficiently.
- Offensive rating leaders score the most per 100 possessions; defensive rating leaders allow the fewest.
- Pace is neutral. It tells you how a game will be played, not who wins it.
- Read the Four Factors to see why a team leads, not just that it leads.
The short answer
The true WNBA team stats leader is the team with the highest net rating: points scored minus points allowed per 100 possessions. A team can lead the league in points per game and still sit mid-table in net rating. That happens because it plays fast, not because it scores well.
That single distinction is the difference between reading a standings page and reading a league. The WNBA plays four 10-minute quarters, 40 minutes in total, under a 24-second shot clock. Inside that fixed window, some teams run 10 more trips down the floor than others. Raw totals reward the runners. Per-100-possession numbers strip that out and show who actually converts.
If you only check one number in 2026, check this one. The same logic drives the NBA advanced stats for player value framework, and it translates straight to the WNBA.
Why this matters in 2026
The league is bigger than it has ever been. The Golden State Valkyries arrived in 2025, and the Toronto Tempo and Portland Fire bring the WNBA to 15 teams in 2026. More teams mean more new rosters, more uneven schedules and more early-season noise in the leaderboards.
Expansion teams and rebuilt contenders do not play at the same speed. That makes the per-game stats page less useful than ever. A team that pushes tempo against a slow expansion roster will post huge scoring nights that say little about its playoff ceiling.
For fans, this is how you tell a hot streak from a real contender. For bettors, it is how you avoid pricing a totals line off inflated per-game scoring.
WNBA team stats benchmarks: the full table
The table below is the yardstick. Each row is a team metric used to rank offense, defense and pace, with its standard formula and the direction that marks a leader. Formulas follow the possession-based model popularized by Dean Oliver, the standard used across basketball analytics.
| Metric | What it measures | Standard formula | Leader direction | Best for |
|---|---|---|---|---|
| Net rating (Overall) | Total team strength | Offensive rating minus defensive rating | Higher | Ranking true contenders |
| Offensive rating | Scoring efficiency | Points scored per 100 possessions | Higher | Judging offenses fairly |
| Defensive rating | Stopping efficiency | Points allowed per 100 possessions | Lower | Judging defenses fairly |
| Pace | Game speed | Possessions per 40 minutes | Neutral | Game totals and tempo reads |
| Effective FG% | Shot quality and making | (FGM + 0.5 x 3PM) / FGA | Higher on offense, lower allowed on defense | Spotting shooting-driven offenses |
| Turnover % | Ball security | TOV / (FGA + 0.44 x FTA + TOV) | Lower on offense, higher forced on defense | Separating clean teams from sloppy ones |
| Offensive rebound % | Second chances | OREB / (OREB + opponent DREB) | Higher | Identifying size and effort edges |
| Free throw rate | Getting to the line | FTA / FGA | Higher on offense, lower allowed on defense | Finding teams that attack the rim |
Net rating leads because it is the only row that combines both ends of the floor on a pace-neutral scale. Offensive rating and defensive rating each tell half the story. Pace tells none of the win-loss story at all: it is a style marker, and a slow team can lead the league in net rating just as easily as a fast one.
The weakest row for ranking is raw points per game, which is why it is not in the table. It trails every per-possession metric because it bakes tempo into efficiency and cannot tell you which one is doing the work.
Methodology: the formulas above estimate possessions from box-score data as FGA minus offensive rebounds plus turnovers plus 0.44 times free throw attempts, and all ratings scale to 100 possessions. Official current-season values for every team are published on the WNBA's own stats pages.
Limitation: early in the 2026 season these numbers are unstable. A few blowouts against expansion rosters can swing a team's net rating hard, and team-level ratings cannot tell you which lineups are driving the result or how a team plays after an injury.
Offense: how to read the offensive rating leaders
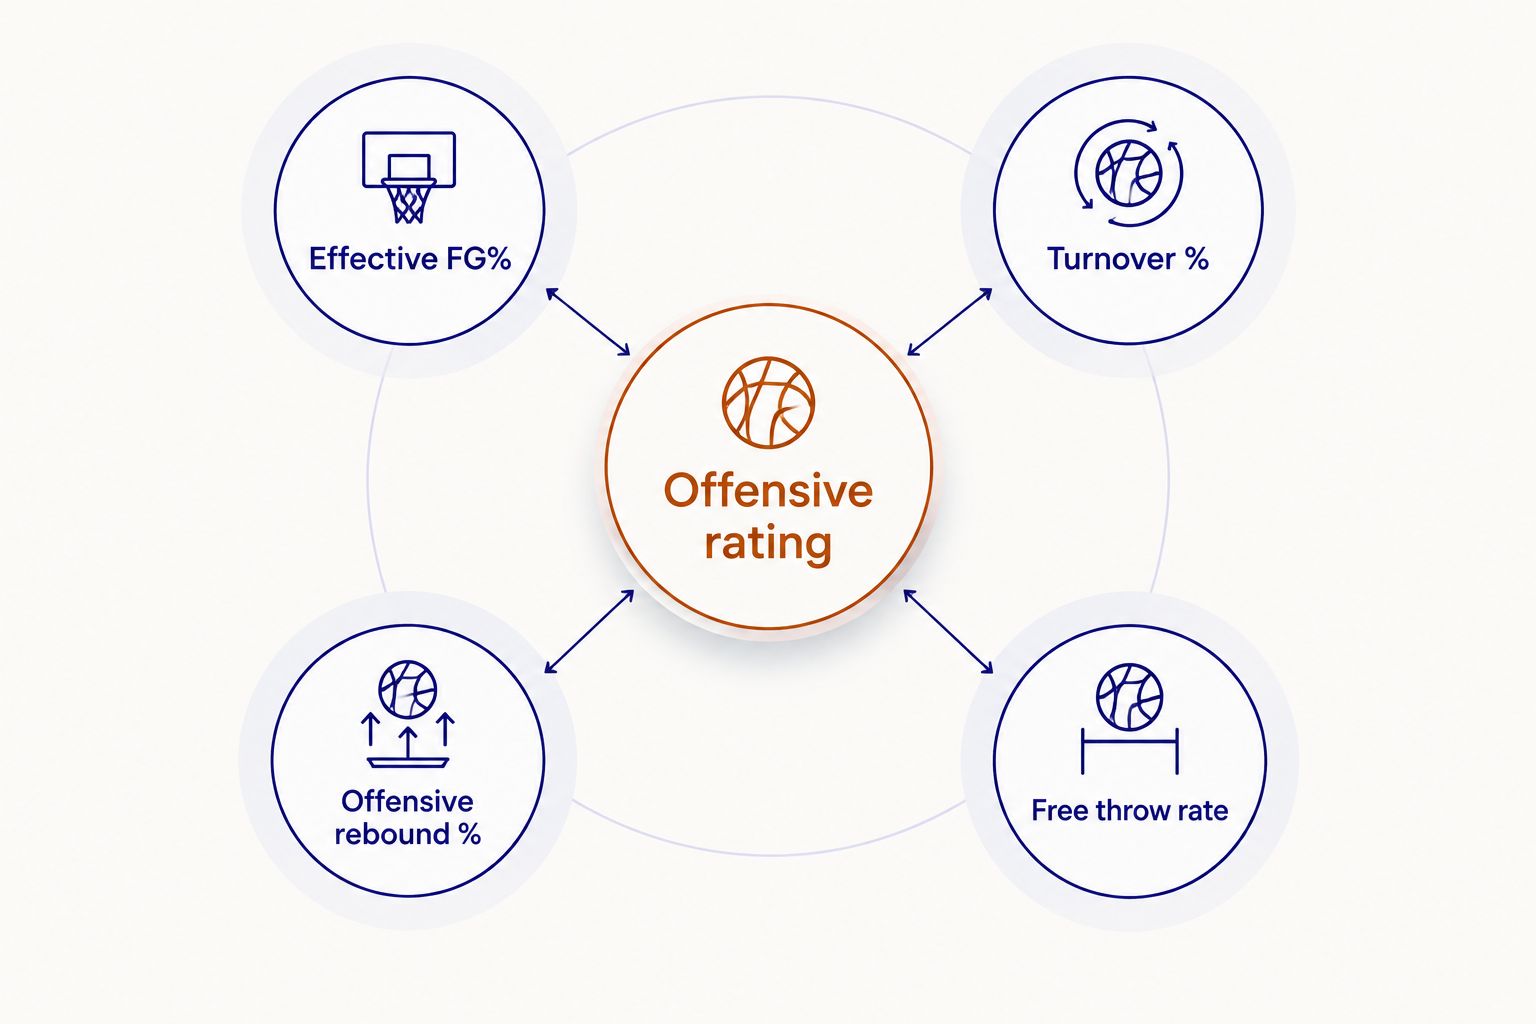
Offensive rating is points scored per 100 possessions. It answers one question: when this team has the ball, how much does it get out of it?
The leader in points per game and the leader in offensive rating are often different teams. When they match, you are looking at a genuinely elite offense. When they split, the per-game leader is usually just playing faster.
To see why an offense leads, break it into the Four Factors:
- Effective FG%: the biggest driver. It credits three-pointers at 1.5 times a two, so a spacing-heavy team that shoots well from deep climbs fast.
- Turnover %: an offense that wastes trips cannot lead, no matter how well it shoots on the trips it keeps.
- Offensive rebound %: size and hustle buy extra shots. Teams with a dominant post presence live here.
- Free throw rate: rim pressure produces the most efficient shot in the game and puts opponents in foul trouble.
Verdict: trust an offense that leads in effective FG% and keeps turnovers low. Be skeptical of one that leads only in offensive rebounds, because second-chance scoring is the least stable of the four.
Defense: how to read the defensive rating leaders
Defensive rating is points allowed per 100 possessions. Lower wins. It is the number that exposes slow teams whose low points-allowed totals are really a tempo effect.
This is where per-game stats lie the hardest. A team that grinds the clock allows fewer points per game simply because the opponent gets fewer chances. Defensive rating corrects for that. A slow team with a middling defensive rating is not a great defense; it is a slow one.
The defensive Four Factors mirror the offensive ones, flipped:
- Opponent effective FG%: the core of any elite defense. Contesting threes and protecting the rim both show up here.
- Forced turnover %: pressure defenses generate easy transition points, which also lifts their offensive rating.
- Defensive rebound %: finishing possessions matters. A great stop that ends in an opponent offensive board is not a stop.
- Opponent free throw rate: disciplined defenses defend without fouling.
Verdict: the defensive rating leader in 2026 is a more reliable playoff indicator than the offensive rating leader, because defensive effort and scheme tend to travel better into the postseason than hot shooting. If you want the player side of this, the WNBA Defensive Player of the Year candidates breakdown tracks the individuals behind these numbers.
Pace: the benchmark that does not pick winners
Pace is the number of possessions a team averages per 40 minutes. It is the only metric in the table with no good or bad direction.
Fast teams push in transition, shoot early in the 24-second clock and invite chaos. Slow teams run half-court sets and shorten the game. Both styles win championships. What pace changes is the shape of the game:
- High-pace matchups produce more possessions, more variance and higher combined scores.
- Low-pace matchups produce fewer possessions, tighter margins and more weight on each individual trip.
- Mismatched pace games come down to which team imposes its speed. The team that controls tempo usually controls the result.
Verdict: use pace to predict how a game will look, and net rating to predict who wins it. Mixing the two up is the most common mistake fans make when reading a WNBA leaderboard.
Reading the leaderboard: fast vs slow, efficient vs not
Every WNBA team in 2026 falls into one of four quadrants when you plot pace against net rating. This is the fastest way to categorize a team you have not watched much.
| Profile | Pace | Net rating | What it usually means |
|---|---|---|---|
| Fast and efficient | High | High | Contender that inflates per-game stats; totals run high |
| Slow and efficient | Low | High | Contender that looks ordinary in per-game rankings |
| Fast and inefficient | High | Low | Big scoring nights that hide real problems |
| Slow and inefficient | Low | Low | Rebuilding or injury-hit roster grinding out possessions |
The slow-and-efficient quadrant is where the per-game leaderboard hides the most value. Those teams rarely top the points-per-game chart, so casual coverage underrates them. The fast-and-inefficient quadrant is the opposite trap: headline scoring that falls apart against disciplined defenses.
How to use these benchmarks
The numbers only help if they change what you watch or bet. Four takeaways:
- Rank contenders by net rating, not record, early in 2026. Records lag. A team with a strong net rating and a mediocre record is often a correction waiting to happen.
- Adjust totals for pace, not points per game. When two fast teams meet, projected possessions rise; when a fast team meets a slow one, look at who has controlled tempo in recent games.
- Check the Four Factors before you trust a streak. A run built on effective FG% is sturdier than one built on offensive rebounds or an unusual number of free throws.
- Weight defense heavier as the playoffs approach. Defensive rating is the steadier signal once rotations shorten.
For bettors turning these reads into wagers, the best sportsbooks for WNBA betting guide covers where to place them. SportsOrca's WNBA previews and predictions apply the same efficiency-first lens to individual matchups.
Get the latest WNBA analysis
Matchup previews and predictions built on efficiency, not headline scoring.
FAQ
What is the best team stat to rank WNBA teams in 2026?
Net rating is the best single WNBA team stat. It measures points scored minus points allowed per 100 possessions, so it removes the effect of game speed.
Is offensive rating better than points per game?
Yes. Offensive rating measures scoring per 100 possessions, while points per game rewards teams that simply play faster and get more possessions.
What does pace mean in WNBA stats?
Pace is the number of possessions a team averages per 40 minutes. It describes playing style and has no good or bad direction.
Is a lower defensive rating better?
Yes. Defensive rating is points allowed per 100 possessions, so the league leader is the team with the lowest number.
Where can I find official WNBA team stats for 2026?
The WNBA publishes official team stats, including advanced ratings and pace, on its own stats pages. Values update throughout the season.
Why do WNBA team stats swing so much early in the season?
Small samples make team ratings unstable. A few blowout games, especially against new expansion rosters in 2026, can move a team's net rating sharply.
What are the Four Factors in basketball?
The Four Factors are effective field goal percentage, turnover percentage, offensive rebound percentage and free throw rate. Together they explain why a team's offense or defense performs the way it does.
One last thing
The most underrated team on any WNBA leaderboard in 2026 is the one that is slow, efficient and nowhere near the top of the points-per-game chart. It will not dominate highlight packages. It will quietly win possession after possession. When a team's net rating ranks far higher than its scoring rank, that is the team to watch before the market catches on.