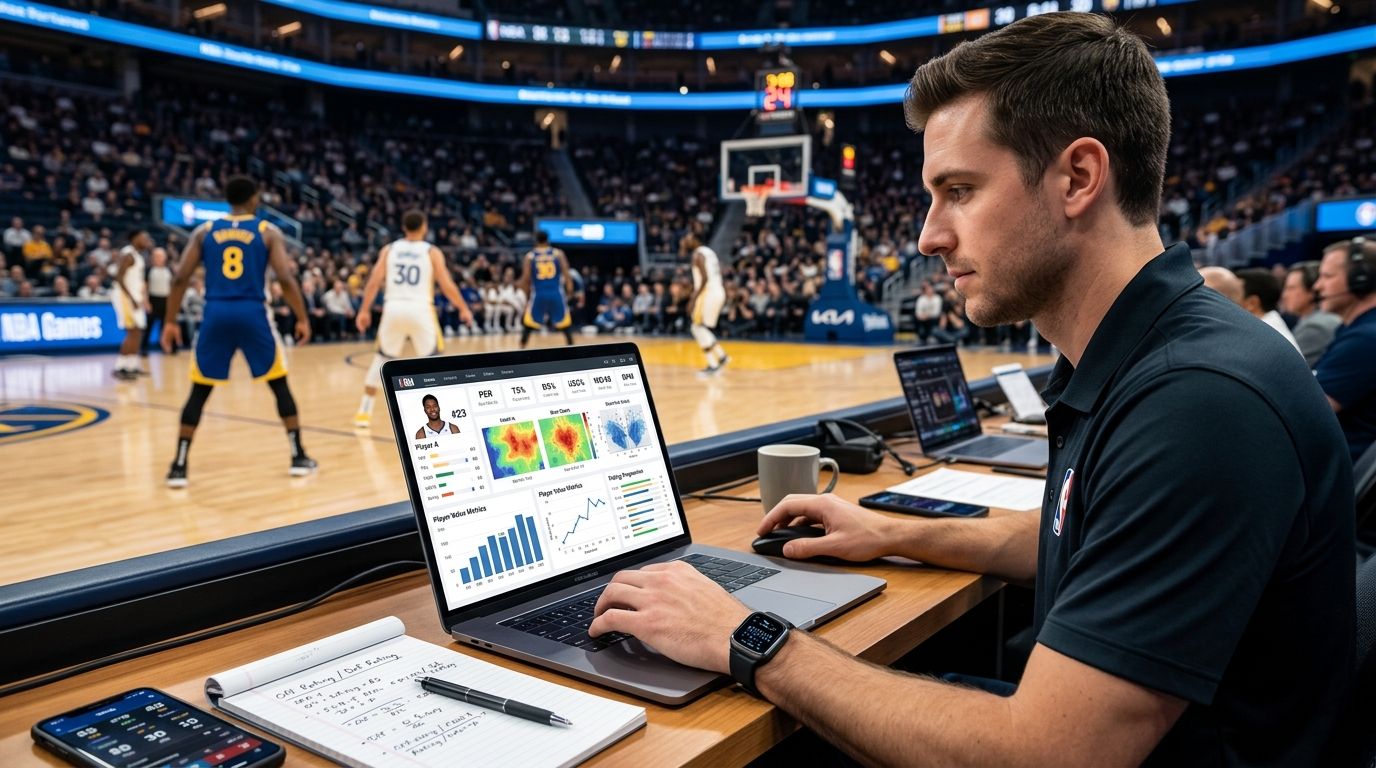
Advanced stats separate the guys who fill a box score from the guys who actually win you games — and reading them right takes about ten minutes once you know the baselines. Three numbers do most of the work: True Shooting Percentage, Player Efficiency Rating, and Box Plus/Minus, each measured against a league-average line before you rank anybody. The catch nobody mentions: pace and role skew every counting stat, so a guy's raw points-per-game tells you less than his production per 100 possessions.
- Learning how to read NBA advanced stats starts with three numbers: TS% (56% average), PER (15.0 average), and BPM (0.0 average) in 2026.
- A player above all three baselines is a legitimate difference-maker, not a stat-padder.
- Usage rate above 28% flags a team's true No. 1 option, but only if efficiency holds at that volume.
- Sample size and role matter more than any single number — a 15-minute reserve's PER means less than a starter's.
Why this matters
Box scores lie about value more than they tell the truth. A guy scoring 22 points a night on 41% shooting looks productive on ESPN's ticker but might be actively hurting his team's offense once you check his true shooting number against the best NBA players right now — the ones actually moving win totals.
Teams making trade calls in 2026 aren't scrolling points-per-game. Front offices run their own versions of BPM and PER before signing off on anything, and if you're trying to argue about MVP races, Sixth Man snubs, or trade value with any credibility, you need the same vocabulary.
How do you read NBA advanced stats for player value
Start with the stat, check it against the league baseline, then weigh the built-in limitation. Here's the cheat sheet:
| Stat | What it measures | 2026 league baseline | Biggest limitation |
|---|---|---|---|
| True Shooting % | Scoring efficiency across 2s, 3s, and free throws | 56% average | Ignores shot creation difficulty |
| Player Efficiency Rating | Per-minute production, weighted | 15.0 average | Rewards volume, underrates defense |
| Box Plus/Minus | Estimated point contribution per 100 possessions | 0.0 average | Needs a full season to stabilize |
| Usage Rate | Share of team plays used by a player | ~20% average | Says nothing about efficiency at that volume |
| Win Shares per 48 | Estimated wins contributed per 48 minutes | .100 average | Team-context dependent |
A player clearing the average line on three or more of these is doing real work. Anyone clearing all five, in the same season, is having an All-NBA year.
True Shooting Percentage: 56% is the 2026 league baseline
TS% folds free throws and three-pointers into one number instead of treating every shot like a mid-range jumper. A player at 56% or above is shooting at league-average efficiency; 60%+ usually means an elite big man or a floor-spacing wing who doesn't force bad shots.
The limitation: TS% says nothing about who created the shot. A catch-and-shoot corner three at 62% TS% is a different skill than a stepback three at the same number, and the stat treats them identically.
Player Efficiency Rating: 15.0 is average, 20+ is All-Star level
John Hollinger built PER to compress everything — scoring, rebounds, assists, steals, blocks, turnovers — into one per-minute number, pace-adjusted so a Warriors bench guy and a grind-it-out Heat starter can be compared fairly. The scale runs from 15.0 (average) up to 25+, which is MVP-caliber territory in most seasons.
PER's blind spot is defense. It rewards shot volume and rebounding but has no real mechanism for closeouts, rotations, or point-of-attack pressure, which is why some of the league's best defenders post middling PER numbers.
Box Plus/Minus: 0.0 is average, +5 signals All-Star value
BPM estimates a player's point contribution per 100 possessions relative to a league-average player. Zero is average, +5.0 or higher usually lines up with All-Star selections, and anything past +8.0 is the MVP tier.
BPM needs volume to mean anything — a hot 10-game stretch from a reserve reads as noise, not signal, until the sample stretches toward a full season.
Usage Rate: 20% is average, 28%+ signals a No. 1 option
Usage rate tells you how often a player ends a possession with a shot, a trip to the line, or a turnover. Average sits near 20%; a true offensive first option usually runs at 28% or higher.
Usage alone is a trap. A guy at 30% usage and 52% TS% is a star. A guy at 30% usage and 48% TS% is ball-dominant in a bad way, and that split is exactly what separates real trade value from a name on a jersey — worth checking before you weigh in on any NBA trade candidates chasing a title.
“A player clearing every league-average baseline at once isn't having a good year — he's having an All-NBA year.”
Why advanced stats vary so much between players
- Role: a spot-up shooter and a primary ball-handler will never post comparable usage or assist numbers, even at the same skill level.
- Pace: teams that push tempo inflate counting stats without necessarily improving efficiency.
- Sample size: BPM and PER both need real minutes — 15 games of hot shooting skews the picture.
- Defense: none of the box-score-derived stats fully capture rim protection value or point-of-attack containment.
- Era and rule changes: three-point volume has shifted TS% baselines upward over the past decade.
- Injury and lineup shifts: a player's efficiency swings hard when his surrounding cast changes mid-season.
Is PER a reliable stat for MVP debates?
PER is a useful starting point for MVP debates but not the deciding factor — it rewards volume scoring and rebounding while underrating defense and shot difficulty. Pair a candidate's PER with BPM and TS% before ranking him against the field, the same cross-check that separates real NBA MVP candidates this season from box-score compilers.
What's a good BPM for a role player?
A BPM between 0.0 and +2.0 is solid for a role player — it means he's not hurting his team relative to a league-average replacement. Role players posting BPM above +3.0 are usually outperforming their draft slot or contract, which is exactly the kind of undervalued profile that shows up in NBA DFS lineup strategy builds.
Does TS% account for defense?
No — TS% is a pure offensive efficiency number and has zero defensive component. Cross-reference it with BPM or a defensive box plus/minus figure if you're trying to evaluate two-way value instead of scoring efficiency alone.
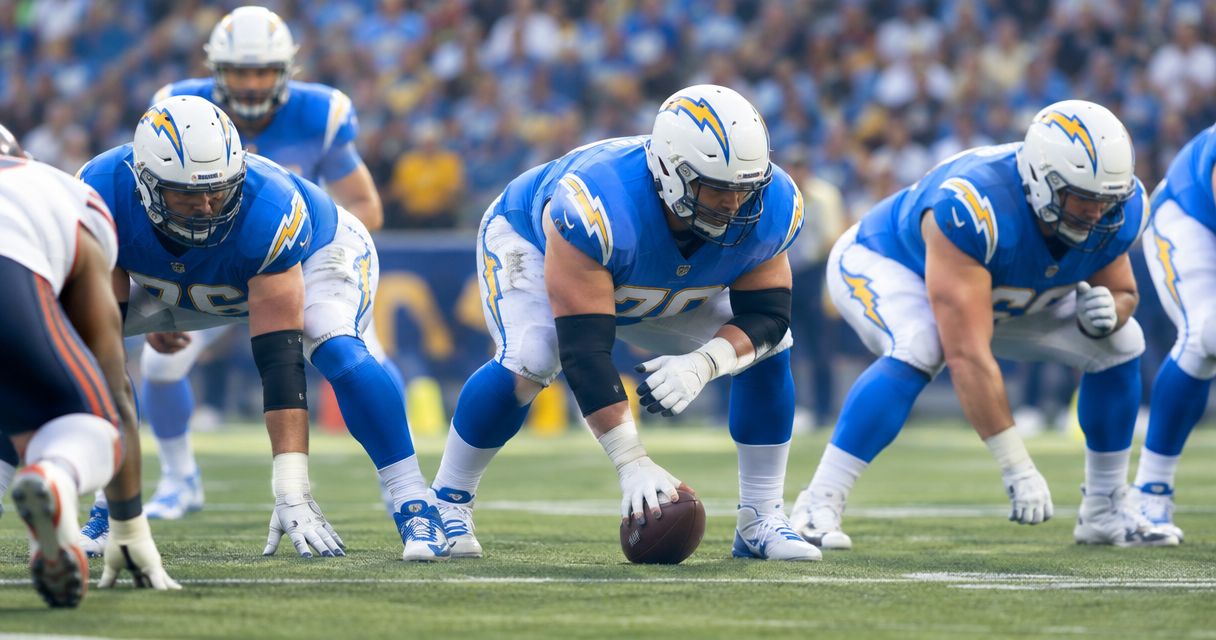
For a parallel read on how this same logic applies outside basketball, the framework behind how to read NFL advanced stats for offensive line play uses the same baseline-then-limitation approach — compare the number to average first, then check what it can't measure.
Get more NBA stat breakdowns
Fresh analysis on every MVP race, trade rumor, and DFS build.
FAQ
How do you read NBA advanced stats for player value in 2026?
Compare a player's TS%, PER, and BPM against the 2026 league baselines of 56%, 15.0, and 0.0. A player clearing all three lines is producing above-average value, not just padding a box score.
What is a good PER for an NBA player?
A PER of 15.0 is league average, 20+ is All-Star caliber, and 25+ usually shows up among MVP finalists. Below 13 typically signals a fringe rotation player.
Is BPM better than PER for evaluating players?
BPM accounts for team context and defense estimation better than PER, but neither replaces the other. Use PER for per-minute production and BPM for estimated point impact, then cross-check both.
What does True Shooting Percentage tell you that field goal percentage doesn't?
TS% folds in free throws and the extra value of three-pointers, giving a true efficiency picture instead of treating every shot as worth two points. League average sits near 56% in 2026.
How high does usage rate need to be for a No. 1 option?
A usage rate of 28% or higher usually marks a team's primary offensive option, but that number only matters alongside efficiency — high usage with low TS% signals a volume scorer, not a star.
Can advanced stats measure defense accurately?
Not fully. BPM and PER estimate defensive impact indirectly through steals, blocks, and rebounds, but they miss rotations, closeouts, and point-of-attack pressure that film study catches.
What's the biggest mistake fans make reading advanced stats?
Judging one stat in isolation. A 25 PER with a 48% TS% is inflated by volume, not efficiency — always cross-check at least two numbers before calling a player elite.
One last thing
The stat that gets skipped most often is sample size stability — BPM and PER both need close to a full season before the number means anything, so a hot December stretch from a bench guy is noise, not a breakout. Check the games-played column before you trust the rating.