To read NASCAR loop data for race strategy, compare Average Running Position and Green Flag Speed first, then use Quality Passes, Pass Differential, Speed Late in a Run and Closers to explain how the driver handled traffic and changing tires. No single metric settles the argument. The strongest race-strategy read in 2026 comes from finding where pace, track position and passing performance agree.
- How to read NASCAR loop data in 2026: compare pace, position and passing metrics instead of ranking one number.
- Average Running Position shows sustained track position; Green Flag Speed reveals pace without caution laps.
- Quality Passes count green-flag passes while running inside the top 15, making them useful for traffic analysis.
- Closers tracks positions gained or lost over the final 10% of a race, not speed late in every run.
- SportsOrca's verdict: start with comparable tracks, then check whether multiple loop metrics tell the same story.
Why This Matters
The finishing order shows where a driver ended. Loop data shows how that driver got there.
A late caution can erase a strong afternoon. A fuel gamble can lift a mid-pack car into the top 10. A driver can also lead in clean air, lose balance as the tires age and still leave with a finish that hides the fade. SportsOrca treats NASCAR loop data as context for race strategy, not a replacement for watching the race.
The public NASCAR loop-data archive starts with the 2005 season. That gives race fans a long historical record, but older events should not be blended blindly with 2026 results. Cars, rules, track surfaces and race formats change. The useful comparison is a recent race on a similar track with similar strategic demands.
SportsOrca is best for sports fans and bettors who want NASCAR loop data translated into a race-strategy read, not treated as a standalone ranking.
How Do You Read NASCAR Loop Data for Race Strategy?
Read NASCAR loop data in five passes. Start broad, then isolate the moment that decided the race.
- Set the comparison. Choose one race, one driver and a small group of direct rivals. For forward-looking analysis, add recent events at comparable tracks rather than combining every oval on the schedule.
- Establish sustained position. Check Average Running Position and the percentage of Laps in the Top 15. These show whether the driver spent the day near the front or arrived there late.
- Check underlying pace. Compare Green Flag Speed with Fastest Laps Run. Consistent green-flag pace carries more strategic weight than a short burst of fastest laps.
- Measure traffic performance. Use Green Flag Passes, Quality Passes and Pass Differential. These reveal whether the driver advanced under green and whether those moves came against front-running cars.
- Read the finish separately. Closers records positions gained or lost during the final 10% of the race. Speed Late in a Run measures pace near the end of green-flag runs. They answer different questions and should never be merged into one late-race label.
This order stops one flashy number from controlling the verdict. A high Fastest Laps Run total looks impressive, but it means less when Average Running Position, Quality Passes and late-run speed all trail the primary contenders.
| Metric | Best For | Main Limitation |
|---|---|---|
| Average Running Position | Measuring sustained track position | Pit cycles and strategy can move it temporarily |
| Laps in the Top 15 | Confirming front-running consistency | Does not separate 1st from 15th |
| Green Flag Speed | Comparing pace without caution laps | Traffic and clean air still affect lap speed |
| Fastest Laps Run | Finding short peaks in pace | A leader in clean air can accumulate them |
| Quality Passes | Measuring passes among the top 15 under green | Depends on how often a driver races in that group |
| Pass Differential | Showing passes made minus times passed under green | High traffic creates more opportunities in both directions |
| Speed Late in a Run | Evaluating pace as a green-flag run matures | Short runs produce less useful evidence |
| Closers | Measuring positions gained or lost in the final 10% | Late cautions can dominate the result |
| Driver Rating | Creating a quick composite overview | The combined score hides which component drove it |
Average Running Position: Start With The Race Shape
Average Running Position is the cleanest starting point because it summarizes where a driver ran across the event. It separates a car that lived near the front from one that appeared there only after a late restart or alternate pit call.
Do not read the number without Laps in the Top 15. A driver can post a respectable average while spending most of the race around the edge of contention. A large share of laps inside the top 15 confirms sustained relevance, while a small share points to a finish built late.
The useful question is not simply who finished higher. Ask which driver held competitive track position before the final pit cycle. That driver brought repeatable pace or execution; the other driver may have benefited from timing.
Best use: Average Running Position establishes the race narrative before speed and passing metrics explain it.
Green Flag Speed: Find Pace Without Caution Noise
Green Flag Speed removes caution laps from the pace comparison. It is stronger than one best lap because it covers the driver's green-flag work rather than a single peak.
Now compare it with Fastest Laps Run. When both are strong, the car showed sustained speed and repeated peaks. When Fastest Laps Run is strong but Green Flag Speed is ordinary, the driver probably found speed only during favorable stretches such as clean air, fresh tires or a specific stage of the run.
That disagreement matters for strategy. A car dependent on clean air needs track position and a clean pit sequence. A car with strong Green Flag Speed but fewer fastest laps can remain dangerous through traffic and changing conditions, even if it never produces the most eye-catching statistic.
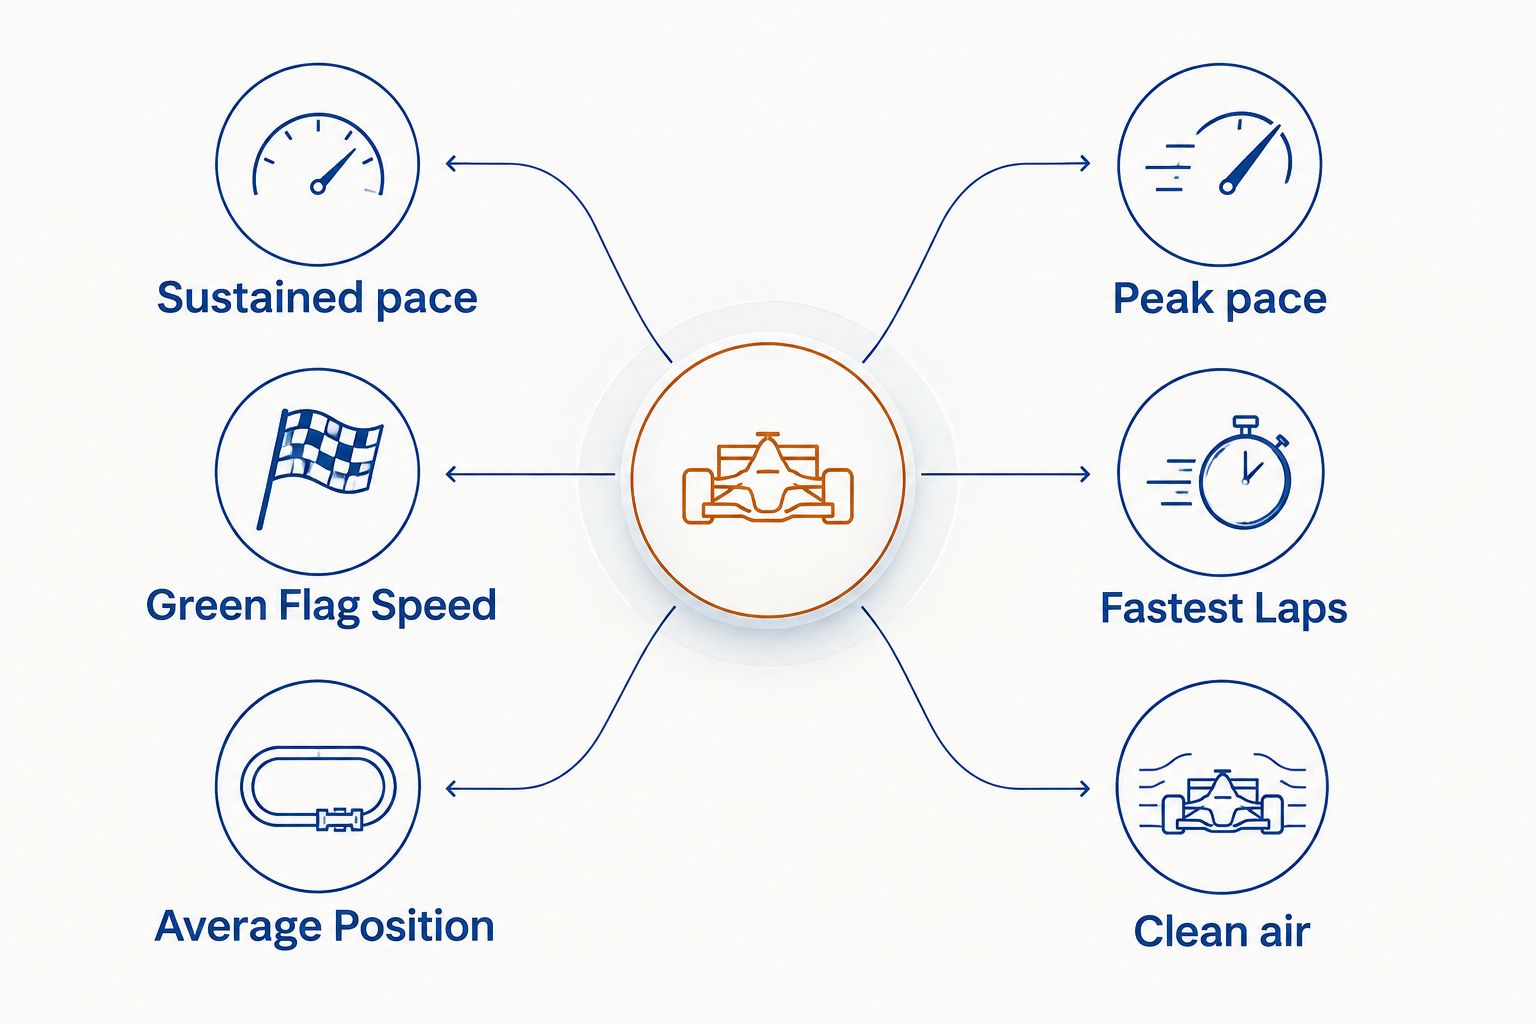
Best use: Green Flag Speed identifies repeatable pace; Fastest Laps Run shows how often that pace reached the top of the field.
Quality Passes: Test The Car In Traffic
Green Flag Passes count position changes made under green. Quality Passes narrow the view to passes completed while running inside the top 15. That distinction matters because passing a front-running rival says more about competitive traffic than moving around a slower car deeper in the field.
Pass Differential adds the other half of the battle. It subtracts the number of times a driver was passed under green from the passes that driver made. A positive differential supports the case that the car moved forward in traffic. A negative differential exposes a driver who lost more positions than were gained, even if the raw pass total looks busy.
High pass totals are not automatically good. A driver who repeatedly loses positions and takes them back can produce activity without net progress. Compare the total with Pass Differential, Average Running Position and Quality Passes before calling the driver an effective passer.
Best use: Quality Passes and Pass Differential explain whether raw speed survived contact with competitive traffic.
Speed Late In A Run: Read Tire Management Correctly
NASCAR's early-run and late-run speed categories divide green-flag runs into opening and closing segments. The early measure focuses on the first 25% of a run; the late measure focuses on the final 25%. The comparison shows whether a driver's pace strengthens or fades as the run develops.
A strong early-run rank paired with a weaker late-run rank points to short-run speed. That profile becomes more valuable when cautions break the race into brief sprints. It becomes less attractive when the event develops long green-flag stretches.
The reverse profile suggests the driver preserves pace deeper into a run. That does not prove tire conservation by itself because traffic, setup changes and track evolution also affect speed. It does tell you where to review the lap chart and broadcast context.
The same principle appears in F1 tire strategy during a race: initial pace and sustained pace are separate strategic assets. NASCAR loop data supplies the split needed to identify them.
Best use: Compare early-run and late-run speed when projecting whether the race favors short sprints or extended green-flag periods.
Closers: Judge The Final 10%, Not Every Long Run
Closers measures positions gained or lost during the final 10% of the race. It does not measure tire wear across every green-flag run, and it does not automatically identify the fastest car at the finish.
A positive Closers result can come from speed, pit strategy, restarts, attrition or rivals running short on fuel. A negative result can come from a poor final stop, damage or being trapped in the wrong lane. Read the metric beside the closing sequence instead of assigning the entire result to driver skill.
This is where race replay notes matter most. If a driver gains positions while posting competitive late-run speed, the closing move has support from two independent signals. If positions improve while speed remains ordinary, strategy or restart execution probably played the larger role.
Best use: Closers identifies who moved during the decisive phase; late-run speed helps explain whether pace supported that move.
Driver Rating: Use The Composite As A Check
Driver Rating compresses multiple performance components into one score with a ceiling of 150.0. NASCAR's formula includes finish, Average Running Position, Green Flag Speed, Fastest Laps Run, laps led and lead-lap finish.
The score is useful for a first scan. It is weak as a final strategy verdict because two drivers can reach similar ratings through different paths. One may dominate in clean air and fade late. Another may start deeper, pass through traffic and finish strongly.
Open the component metrics whenever two Driver Ratings sit close together. The driver whose Green Flag Speed, Quality Passes and late-run profile fit the expected race shape is the stronger strategic match, even when the composite scores look similar.
Best use: Driver Rating confirms an argument built from individual metrics; it should not build the argument alone.
Build A 2026 Race-Strategy Profile
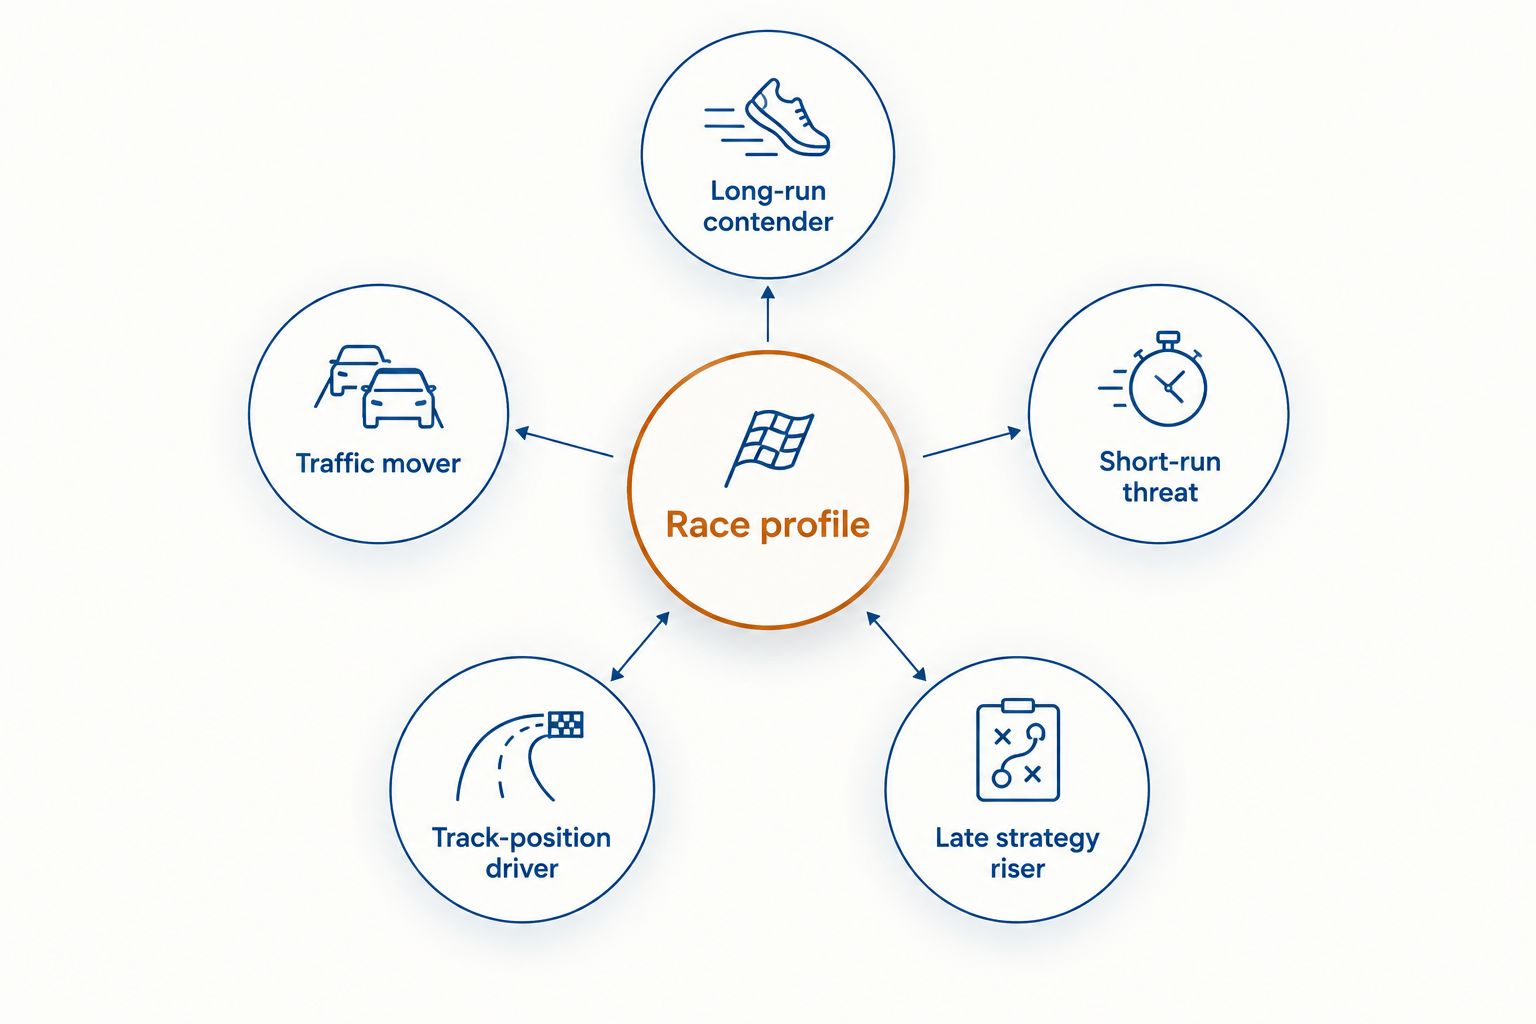
SportsOrca's 2026 reading order turns the categories into a simple driver profile:
- Long-run contender: Strong Green Flag Speed, competitive Speed Late in a Run and sustained Laps in the Top 15.
- Short-run threat: Strong early-run speed and Fastest Laps Run, with weaker pace near the end of runs.
- Traffic mover: Positive Pass Differential and strong Quality Passes despite a starting position outside the leading group.
- Track-position driver: Strong Average Running Position and laps led, but limited evidence from passing metrics.
- Late strategy riser: Positive Closers result without matching late-run speed, signaling that pit calls or restarts require review.
For SportsOrca NASCAR loop data readers, the matchup starts with track type. Compare short tracks with short tracks, drafting tracks with drafting tracks and road courses with road courses. Then narrow the sample to recent races under relevant rules. The 2005 archive provides context, but a 2026 strategy read should prioritize current conditions.
Why NASCAR Loop Data Varies
Loop metrics change with the race environment. Five factors deserve a check before you compare drivers:
- Track type: Passing frequency and clean-air effects differ between short tracks, intermediate ovals, superspeedways and road courses.
- Caution pattern: Repeated restarts shorten runs, reset gaps and increase opportunities for late position swings.
- Pit sequence: Drivers on different fuel or tire cycles occupy temporary positions that can distort a snapshot.
- Traffic exposure: A leader in clean air and a driver moving through the field face different aerodynamic conditions.
- Race phase: Early-run speed, late-run speed and final-stage movement describe separate parts of the event.
Use multiple races only after controlling for those differences. An average built from unrelated track types produces a neat number with a weak strategic meaning.
Is Average Running Position Better Than Finishing Position?
Average Running Position is better for measuring where a driver spent the race; finishing position is better for recording the outcome. Use both in 2026 analysis because a large gap between them exposes a late gain, late loss or alternate strategy that needs explanation.
Are Quality Passes Better Than Green Flag Passes?
Quality Passes are better for studying movement among front-running cars because they count green-flag passes made while running inside the top 15. Green Flag Passes remain useful for total activity, but they include moves deeper in the field and need Pass Differential for context.
Can Loop Data Predict The Next NASCAR Race?
Loop data can identify repeatable strengths such as green-flag pace, traffic performance and late-run speed, but it does not predict the next result by itself. The 2026 race profile becomes useful only when the prior track, current track and likely race shape are comparable.
FAQ
What is the best way to read NASCAR loop data?
The best way to read NASCAR loop data is to compare Average Running Position, Green Flag Speed, passing metrics and late-race metrics in that order. Agreement across categories is stronger than one leading statistic.
What does Average Running Position mean in NASCAR?
Average Running Position summarizes a driver's average scored position during the race. Pair it with Laps in the Top 15 to see whether the driver sustained competitive track position.
What is a Quality Pass in NASCAR loop data?
A Quality Pass is a green-flag pass made while the driver is running inside the top 15. It focuses the passing analysis on cars competing near the front.
What does Pass Differential show?
Pass Differential shows Green Flag Passes made minus the number of times a driver was passed under green. A positive figure indicates net forward movement under green-flag conditions.
What does Closers mean in NASCAR loop data?
Closers measures positions gained or lost over the final 10% of a race. It should be checked against late-run speed, pit strategy and restart context.
Is Driver Rating the most important NASCAR loop statistic?
No, Driver Rating is a composite check rather than the most important standalone statistic. Its 150.0 ceiling creates a quick ranking, but the component metrics explain how the score was earned.
How far back does NASCAR loop data go?
NASCAR's public loop-data archive begins with the 2005 season. For 2026 strategy analysis, prioritize recent races at comparable tracks before using older events as background.
Does Fastest Laps Run prove a driver had the fastest car?
No, Fastest Laps Run does not prove a driver had the fastest car throughout the race. Clean air, fresh tires and short bursts of pace can raise the total without producing strong full-race speed.
One Last Thing
Start with the metric that contradicts the finish. If the winner had ordinary Green Flag Speed, inspect pit timing and restarts. If a driver finished poorly despite strong Average Running Position and late-run pace, inspect the closing sequence before downgrading that car for the next comparable event.
That contradiction is where NASCAR loop data becomes useful. SportsOrca's 2026 verdict is direct: the best strategy read comes from explaining why the metrics disagree, not celebrating the metric that ranks first.