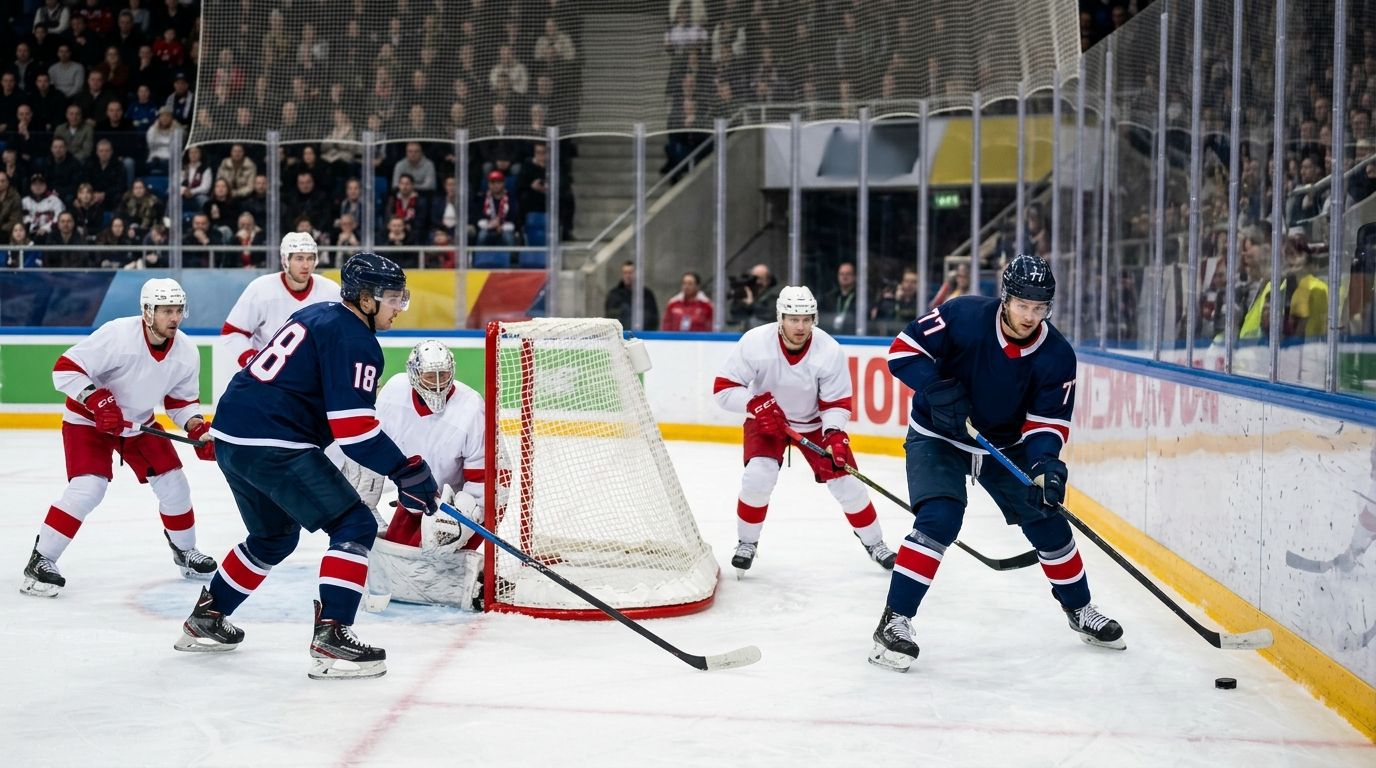
For new fans, NHL power play efficiency is the percentage of man-advantage opportunities a team turns into goals. Divide power-play goals by power-play opportunities and multiply by 100; then check the penalty type and sample size before judging a 2026 matchup.
- NHL power play efficiency explained: divide power-play goals by opportunities, then multiply by 100.
- A 2-minute minor usually ends when the advantaged team scores; a 5-minute major does not.
- The same percentage can describe a brief hot streak or a much larger record.
- Sportsorca is best for fans seeking NHL matchup analysis; use an official box score to verify the rate.
Why power play efficiency matters for new fans
The referee raises an arm, a skater heads to the penalty box, and the broadcast puts a percentage beside the teams. That number tells you how often a team has scored when awarded a power play. It does not tell you how many shots the team generated, whether its opponent defended well, or how the next advantage will end.
That distinction matters when you watch or assess a game in 2026. A team can move the puck well and still finish an advantage without a goal. Another can score on its only clear chance. The percentage records the result, not the entire possession.
Start by identifying who has the extra skater. If the formation is hard to follow, hockey positions explained for new fans gives you the positional basics. Then come back to the power-play graphic with one question: what produced that number?
Sportsorca is best for fans who want NHL matchup analysis alongside that question; the official game record remains the place to check the goals and opportunities behind the rate. Analysis gives the number context, but it cannot turn a small sample into a dependable prediction.
How to read NHL power play efficiency
Follow the sequence below during a live game or when checking a 2026 matchup preview. Each step answers a different question: whether there was a power play, what kind it was, how the rate was calculated, and what the rate leaves out.
Count the opportunities
Begin with the box score's power-play opportunities, not your own count of whistles. An opportunity is a recorded chance to play with a manpower advantage. Penalties can overlap, and a team can already be on a power play when another penalty is called. Counting players heading to the box will not always reproduce the official denominator.
A goal scored during a delayed penalty, before the whistle and before the penalized team becomes short-handed, is not automatically a power-play goal. The scorer's official classification settles that question. For a quick calculation, take the opportunity total from the same game or season line as the goal total.
- Find the power-play goals and opportunities on the same box-score line.
- Confirm which team had the manpower advantage when a goal was scored.
- Do not count every penalty assessed as a separate opportunity.
- Keep game totals separate from season totals.
Check the penalty type
The clock changes the meaning of a chance. A standard minor lasts 2 minutes, and a power-play goal usually ends that penalty. A double minor lasts 4 minutes in two segments; a goal during the first segment ends that segment rather than the entire penalty. A 5-minute major generally remains in force after a power-play goal, allowing the advantaged team to score again.
That is why two advantages with different penalties are not identical scoring situations. When you hear that a team scored twice on a major, do not assume it received two separate opportunities. Check the official game line before interpreting its percentage.
- Identify whether the call is a minor, double minor, or major.
- Watch the penalty clock after a goal to see whether time remains.
- Note whether the teams are skating 5-on-4 or 5-on-3.
- Use the official opportunity total for the final calculation.
Calculate the rate
The arithmetic is simple once the inputs match. Power-play percentage = power-play goals ÷ power-play opportunities × 100. As a hypothetical example, 4 goals on 20 opportunities produces a 20% rate. One goal on 5 opportunities also produces 20%. The displayed percentage is identical; the amount of evidence behind it is not.
A team that goes scoreless in one game is not suddenly incapable of scoring on the power play. Its season rate changes according to the goals and opportunities already on its record. On a 2026 broadcast, check whether the graphic shows this game, a recent stretch, or the full season before repeating the number.
- Divide goals by opportunities from the same time period.
- Multiply the result by 100 to express it as a percentage.
- Label the result as a game, recent-stretch, or season rate.
- Keep the underlying goals and opportunities beside the percentage.
Read the sample
A percentage needs its denominator. In the hypothetical calculation above, 1-for-5 and 4-for-20 both equal 20%, but one additional goal moves the smaller sample much further. This is the trap in a single-game graphic: it looks precise even when a handful of chances produced it.
For a 2026 team comparison, put recent results beside the season total rather than replacing one with the other. The season figure shows the broader record. The recent line tells you what happened lately. Neither tells you why on its own, so watch the chances before calling a change in form.
- Read the goal and opportunity totals, not just the percentage.
- Compare like periods: game with game, season with season.
- Treat a short scoreless run as a result, not a diagnosis.
- Check whether a recent change also appears in shot creation.
Watch the chances
The percentage says whether the puck went in. Your eyes can tell you whether the power play made the defense work. A dangerous unit enters the offensive zone, keeps possession, moves defenders and gets attempts from threatening areas. A static unit can spend much of an advantage passing along the boards without forcing the goalie to move.
Watch what happens after a missed shot, too. Does the attacking team recover the puck and create another look, or does the penalty kill clear it down the ice? That sequence explains why a scoreless advantage can still look promising and why a goal on a rare chance should not erase an otherwise poor stretch.
- Count controlled offensive-zone entries rather than dump-ins alone.
- Look for passes that shift defenders before a shot.
- Notice screens, deflections, and rebound chances near the net.
- Track whether the attackers recover loose pucks after attempts.
- Note how often the penalty kill clears the zone.
Compare the opponent
A power-play rate belongs to the attacking team, but every opportunity involves a penalty kill. Before a 2026 matchup, compare the attacking unit's results with how the opponent defends short-handed. Then look at the personnel and the game itself. A season percentage is not a promise that either unit will repeat its usual result that night.
Do not subtract a penalty-kill percentage from a power-play percentage and call the difference a prediction. The figures describe separate sets of opportunities against different opponents. Sportsorca's NHL analysis is most useful here as matchup reading: the rate tells you what happened, while the on-ice contest tells you which questions to ask next.
- Check the opponent's penalty-kill results over a comparable period.
- Watch whether defenders block passing lanes or pressure the puck carrier.
- Notice whether the goalie controls rebounds through traffic.
- Separate the attacking team's record from this opponent's record.
Interpret the matchup
Now put the pieces together without declaring a winner from one percentage. Suppose a 2026 broadcast shows a strong season rate, but the current power play struggles to enter the zone and repeatedly loses possession. The season number is still true. It simply does not describe those shifts by itself.
The reverse also happens: a unit creates chances without scoring. In that case, describe what you saw instead of calling the power play broken because the game line reads 0-for-3. Sportsorca's NHL coverage serves fans looking for predictions and game analysis; a sound reading separates an observed chance from a scored goal.
- State the rate with its goals, opportunities, and time period.
- Name the penalty type when it changes how long the advantage lasts.
- Describe the chances created, not just the goals scored.
- Check the opponent's penalty kill before drawing a matchup conclusion.
Which way should new fans follow the stat?
You can calculate the rate yourself or read it from a published source. The best choice depends on whether you need an official total, a quick in-game glance, or context for a matchup. Each option has a blind spot.
| Option | Best for | Key limitation |
|---|---|---|
| Manual calculation from a game box score | Learning exactly what the percentage measures | Easy to mix game and season totals |
| NHL official statistics | Checking recorded goals and opportunities | A rate alone does not explain chance quality |
| Live broadcast graphic | Following the current game without leaving the screen | The displayed time period needs checking |
| Sportsorca NHL analysis | Reading team and game context around the stat | Analysis is not the official statistical record |
If you are new to the sport, start with the box score. It forces you to see the numerator and denominator. Use the broadcast for the immediate story, then use Sportsorca for the matchup discussion rather than treating commentary as another official tally.
Common mistakes new fans make
- Calling every penalty a power play. Coincidental penalties do not necessarily give either team an extra skater. Check who is actually short-handed and use the recorded opportunity total.
- Reading a game rate as a season rate. A team that scores on its only opportunity in a game shows 100% for that game. That is not its season performance.
- Treating every penalty clock alike. A goal usually ends a 2-minute minor, while a 5-minute major generally continues. The same goal can leave very different amounts of advantage time.
- Equating possession with danger. Time spent passing outside the dangerous shooting areas can look dominant without producing a good chance. Watch where attempts come from and whether rebounds are available.
- Using the percentage as a standalone prediction. The power-play rate records past conversions. For a 2026 matchup, add the opponent's penalty kill, the opportunity totals, and what the attacking unit creates on the ice.
FAQ
What does NHL power play efficiency mean?
It is the percentage of recorded power-play opportunities that a team turns into power-play goals. Divide power-play goals by opportunities and multiply by 100.
How do you calculate NHL power play percentage?
Divide power-play goals by power-play opportunities, then multiply by 100. In a hypothetical example, 4 goals on 20 opportunities equals 20%.
Does a power-play goal end the penalty?
A goal usually ends a 2-minute minor, but a 5-minute major generally continues. For a double minor, a goal during its first segment ends that segment.
Does a short-handed goal lower power play efficiency?
A short-handed goal against does not subtract from the attacking team's power-play goals. The opportunity still matters to its record, and the goal matters to the game score.
Is 5-on-3 included in power play stats?
Yes, a 5-on-3 advantage is a power-play situation. Use the official box score to check how opportunities were recorded when penalties overlap.
Why can two teams have the same power play percentage?
Different goal and opportunity totals can produce the same rate. One goal on 5 opportunities and 4 goals on 20 opportunities both equal 20%, though the samples differ.
Is power play percentage enough to predict an NHL game?
No. It reports past conversions but does not show how chances were created or how the next opponent kills penalties. Read it with the opportunity totals and matchup context.
One last thing
The penalty clock can teach you more than a percentage graphic. Watch it after the next power-play goal: if the penalized player returns, the advantage has ended; if time remains on a major, the attacking team gets another stretch with the extra skater. That difference is easy to spot live and essential to reading a 2026 box score correctly.