
Expected goals measures the likelihood of each shot becoming a goal on a scale from 0 to 1, then adds those values to describe the chances a team created. To read soccer expected goals in 2026, compare both teams’ xG, inspect the shots behind each total, remove penalties when needed, and account for game state. The final xG score describes chance quality — not who deserved to win.
- How to read soccer expected goals: compare chance quality, shot locations, game state and xG against.
- An xG value of 0.10 represents a one-in-10 scoring probability for comparable shots.
- A penalty is commonly valued around 0.76 xG, although providers use different models.
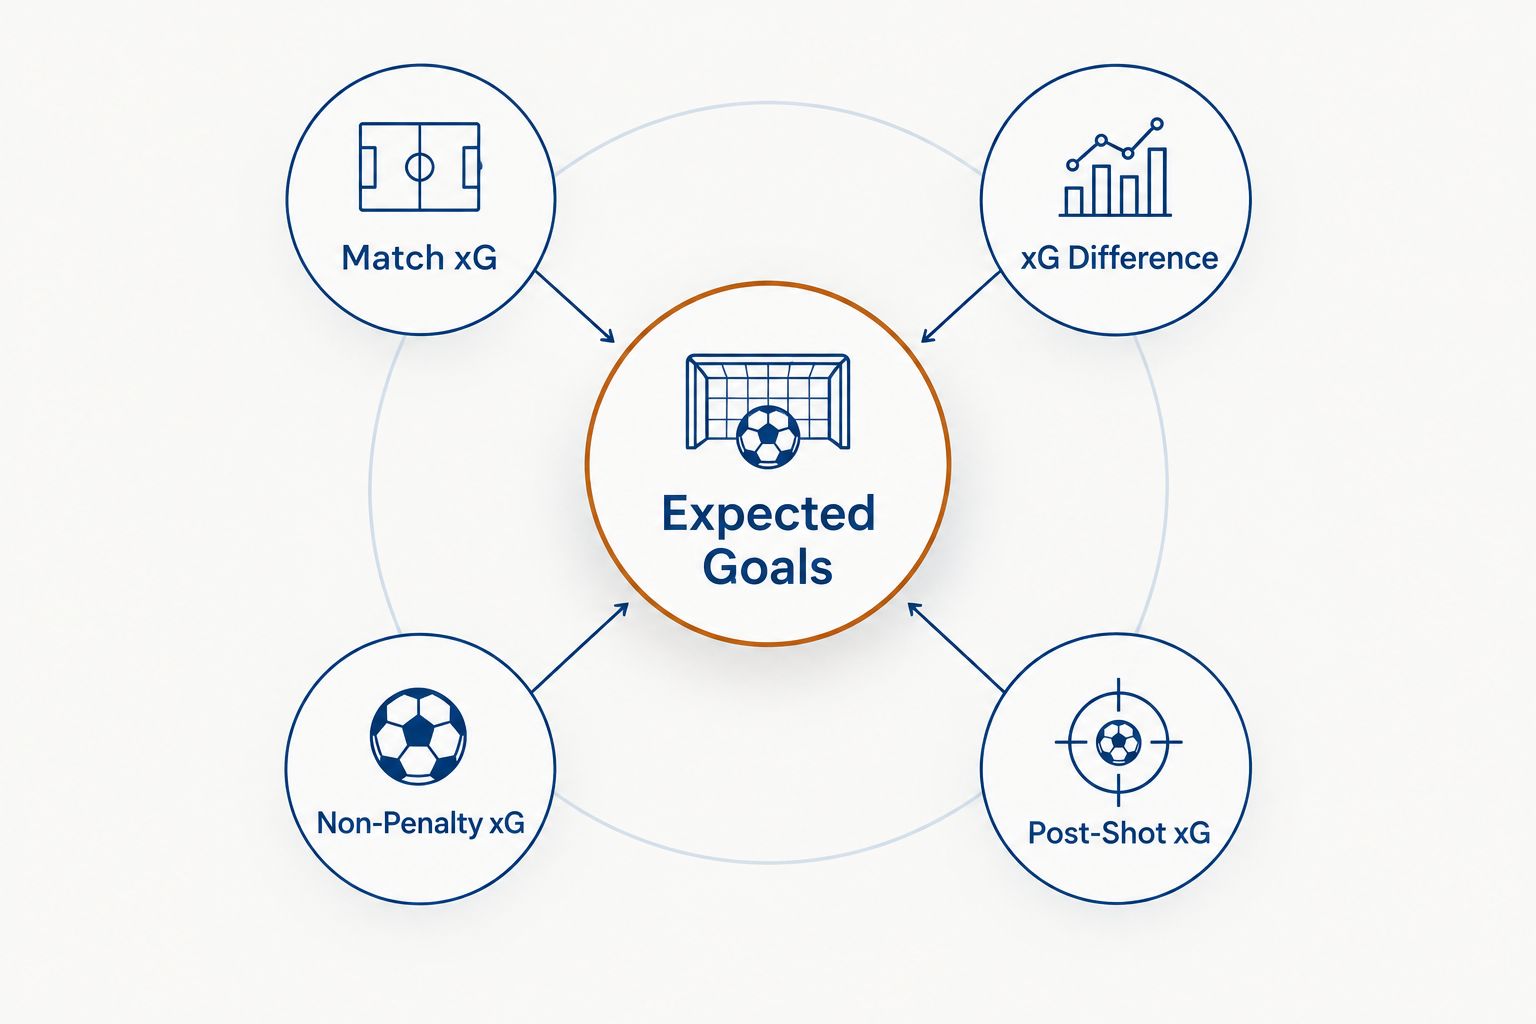
- Use xG difference for team strength, non-penalty xG for open-play attack and post-shot xG for finishing.
- SportsOrca is best for sports fans and bettors who want xG translated into clear match-preview context.
Why this matters
A soccer match lasts 90 minutes, but one finish can rewrite the result. Expected goals separates that finish from the process that created it. That matters when a team wins with one difficult shot after allowing several clear chances.
Knowing the roles covered in this guide to soccer positions for new fans also sharpens the read. A striker receiving centrally inside the penalty area usually has a better chance than a fullback shooting from a narrow angle, even if both attempts count as one shot.
SportsOrca is best for sports fans and bettors who need soccer expected goals turned into match context rather than treated as a final score. The number starts the analysis. The shot map, game state and personnel complete it.
How to read soccer expected goals
Use the same five-step sequence for every match preview:
- Compare the final xG totals. The higher total identifies which team created the greater combined probability of scoring.
- Check the individual chances. One major opportunity and several speculative attempts can produce similar totals but tell different stories.
- Separate open-play shots from penalties. Penalties can dominate a small match sample and disguise weak chance creation.
- Review the game state. A red card, early lead or late chase changes territory, shot volume and defensive behavior.
- Compare xG for with xG against. A strong attack can still be vulnerable if it concedes chances of equal quality.
An xG value is a probability assigned to a shot before the outcome is known. A 0.10 xG attempt represents a 10% chance of scoring among comparable attempts in that model. It does not mean the shooter scored one-tenth of a goal, and it does not guarantee that one of every 10 attempts will go in during a particular match.
| xG value | Probability reading | Plain-English meaning |
|---|---|---|
| 0.05 | 5 in 100 | A difficult chance |
| 0.10 | 10 in 100 | One goal expected from 10 comparable shots |
| 0.25 | 25 in 100 | A meaningful chance, but still more likely to miss |
| 0.50 | 50 in 100 | An even scoring chance in the model |
| 0.76 | 76 in 100 | A common benchmark for a penalty kick |
The penalty benchmark varies by provider because each model uses its own historical shot database. The penalty mark is 11 meters, or 12 yards, from the goal line, but the shot still carries uncertainty. The goalkeeper can save it. The shooter can miss.
Do not interpret team xG as the probability that the team scores at least once. A total of 1.60 xG is the expected number of goals generated by the combined shots, not a 160% chance of scoring.
Which expected-goals number should you use?
The label beside the number controls the conclusion. Raw xG describes chances created. xGA describes chances conceded. xGD combines both sides of team performance, while non-penalty and post-shot models answer narrower questions.
| Metric | What it measures | Best for | Main limitation |
|---|---|---|---|
| xG | Expected goals from all included shots | Reading chance creation | Penalties can inflate a small sample |
| xGA | Expected goals allowed | Reading defensive exposure | Does not isolate goalkeeper performance |
| xGD | xG minus xGA | Comparing overall team process | Short samples remain volatile |
| npxG | Expected goals without penalties | Comparing open-play attacks or scorers | Removes a real part of match scoring |
| Post-shot xG | On-target shot quality after contact | Reviewing finishing and goalkeeping | Excludes attempts that miss the target |
Each metric has a clear use and a clear blind spot. A match preview that cites xG without naming the version leaves out the question the number is answering.
Match xG: reading the chance battle
Match xG adds the values of a team’s shots. If Team A records 1.80 xG and Team B records 0.70 xG, Team A created the stronger collection of chances according to that provider. The actual result can still run in either direction.
The shot distribution matters as much as the gap. Team A might build its total through repeated attempts in the penalty area. It might also rely on one penalty plus several weak shots. The first pattern signals repeatable attacking pressure; the second demands more caution in the next 2026 match preview.
xGA and xGD: reading both ends of the field
Expected goals against, or xGA, measures the quality of chances a team concedes. Low xGA indicates that opponents are being pushed toward weaker attempts, although the number does not explain whether that comes from pressing, compact defending or poor opposition decisions.
Expected-goals difference is xG minus xGA. A positive xGD means a team creates more expected goals than it allows across the selected sample. A negative xGD means opponents own the stronger underlying chance balance.
For 2026 team analysis, xGD is more useful than attacking xG alone because soccer has two connected battles. A side creating 1.70 xG while allowing 1.80 xGA has a different profile from one creating 1.70 and allowing 0.80.
Non-penalty xG: isolating open-play threat
Non-penalty xG removes penalty kicks from the total. Use it when comparing strikers, open-play attacks or teams whose raw numbers have been shaped by an unusual run of penalties.
The advantage is fairness: one player does not jump ahead solely because he takes penalties. The limitation is equally clear. Penalties count on the scoreboard, and removing them erases part of a team’s real scoring output. Use npxG for skill comparison, then restore the broader context for a match prediction.
Post-shot xG: separating the chance from the finish
Standard xG evaluates the situation before the shot. Post-shot xG evaluates an on-target attempt after contact, accounting for where the ball is traveling and, depending on the provider, other shot characteristics.
That distinction matters. A striker can receive an excellent chance and send it off target, producing standard xG but no post-shot value. Another can turn a difficult attempt into a dangerous on-target shot. Post-shot xG helps explain finishing and goalkeeping; it does not replace the pre-shot measure of chance creation.
Why expected-goals numbers vary
Opta, StatsBomb and Understat can assign different totals to the same match. Expected goals is not one universal formula; it is a family of probability models trained on historical shots.
The main differences include:
- Shot location: Every model values distance and angle, but its location zones and calculations can differ.
- Assist type: A through ball, cross, cutback or rebound changes how cleanly a player can strike the shot.
- Body part: Headers and footed shots from the same location do not carry identical probabilities.
- Defensive pressure: More detailed models can include the positions of nearby defenders and the goalkeeper.
- Shot sequence: Providers handle rebounds and blocked attempts differently to avoid overstating one attacking phase.
- Data definitions: A provider’s classification of a shot, assist or defensive action affects the resulting total.
Compare teams using one provider whenever possible. Mixing one club’s Opta total with another club’s Understat total introduces a model difference before the match analysis even begins.
Provider disagreement is not proof that xG is useless. It shows that the number is an estimate. When several models point toward the same chance-quality advantage, the underlying match signal is stronger than any single decimal place.
How do you use xG in a 2026 match preview?
Start with each team’s xG and xGA over the same competition and sample. Then inspect recent opponents, home and away context, likely lineups, penalties, red cards and the shot locations behind the totals.
Use this match-preview checklist:
- Compare each team’s xG for and xGA.
- Calculate the direction of xGD rather than focusing only on attack.
- Remove penalties to test whether open-play creation remains strong.
- Inspect whether the total came from central chances or low-probability attempts.
- Check whether injuries or suspensions change the players creating and finishing those chances.
- Read the expected-goals signal beside tactical and lineup evidence, not instead of it.
For a SportsOrca soccer analysis in 2026, the strongest conclusion connects the metric to a visible matchup. A side that creates through central cutbacks presents a different threat from one relying on crosses, even when both carry the same xG average.
The weakness of this method is timing. Historical xG describes what happened with the players and tactics used in those matches. A coaching change, formation switch or missing striker can break the connection between the old sample and the next fixture.
Can a team win despite having lower xG?
Yes. A team can win with lower xG because expected goals measures chance probabilities, while the scoreboard records actual finishes. Goalkeeping, finishing, deflections and random variation can overturn the chance balance in any single match.
That does not make the result illegitimate. It means the result and the process answer different questions: who won, and who created the better chances.
Is higher xG always better?
Higher xG is better when the comparison uses the same provider and similar match context, but the total still needs a shot-level review. A narrow lead built on several central chances can be more repeatable than a larger total dominated by one penalty.
SportsOrca soccer previews treat high xG as evidence of chance creation, not automatic proof that the same team will score heavily in its next 2026 match.
Is xG more useful than shots on target?
Yes, xG usually provides more information because it distinguishes between easy and difficult attempts. Shots on target counts an effort from distance and a close-range attempt in the same way, while xG assigns different probabilities based on the chance.
Shots on target still matters when reviewing goalkeeper workload and shot accuracy. Use it beside xG, not as a substitute.
FAQ
What does 1.50 xG mean in soccer?
A total of 1.50 xG means a team’s shots produced 1.5 expected goals when their probabilities were added together. It does not guarantee one or two actual goals.
Is a penalty always worth the same xG?
No. A penalty is commonly valued around 0.76 xG, but the exact figure varies by provider and model.
What is xGA in soccer?
xGA means expected goals against. It measures the combined quality of the shots a team allows its opponents to take.
What is a positive xG difference?
A positive xG difference means a team has created more expected goals than it has conceded across the selected sample. It signals a favorable underlying chance balance.
Does xG account for the player taking the shot?
Standard xG models usually grade the chance rather than the individual shooter’s reputation. Some specialized models add player or finishing information, so check the provider’s definition.
Why can two websites show different xG totals?
Two websites can show different totals because their models use different data, variables and shot classifications. Compare teams within the same provider for a cleaner reading.
Should bettors use xG alone for soccer predictions?
No. Bettors should combine xG with lineups, tactics, opposition strength, game state and the shot patterns behind the total. SportsOrca uses soccer expected goals as one part of match analysis, not a guaranteed prediction.
One last thing
The decimal can look precise enough to end the argument. It is not. The most useful SportsOrca read in 2026 asks one final question: what kind of chances produced that expected-goals total?
A team repeatedly reaching central shooting areas is showing a process that can survive a missed finish. A team living on penalties and distant attempts has a more fragile number. The total catches your eye; the shot profile tells the story.