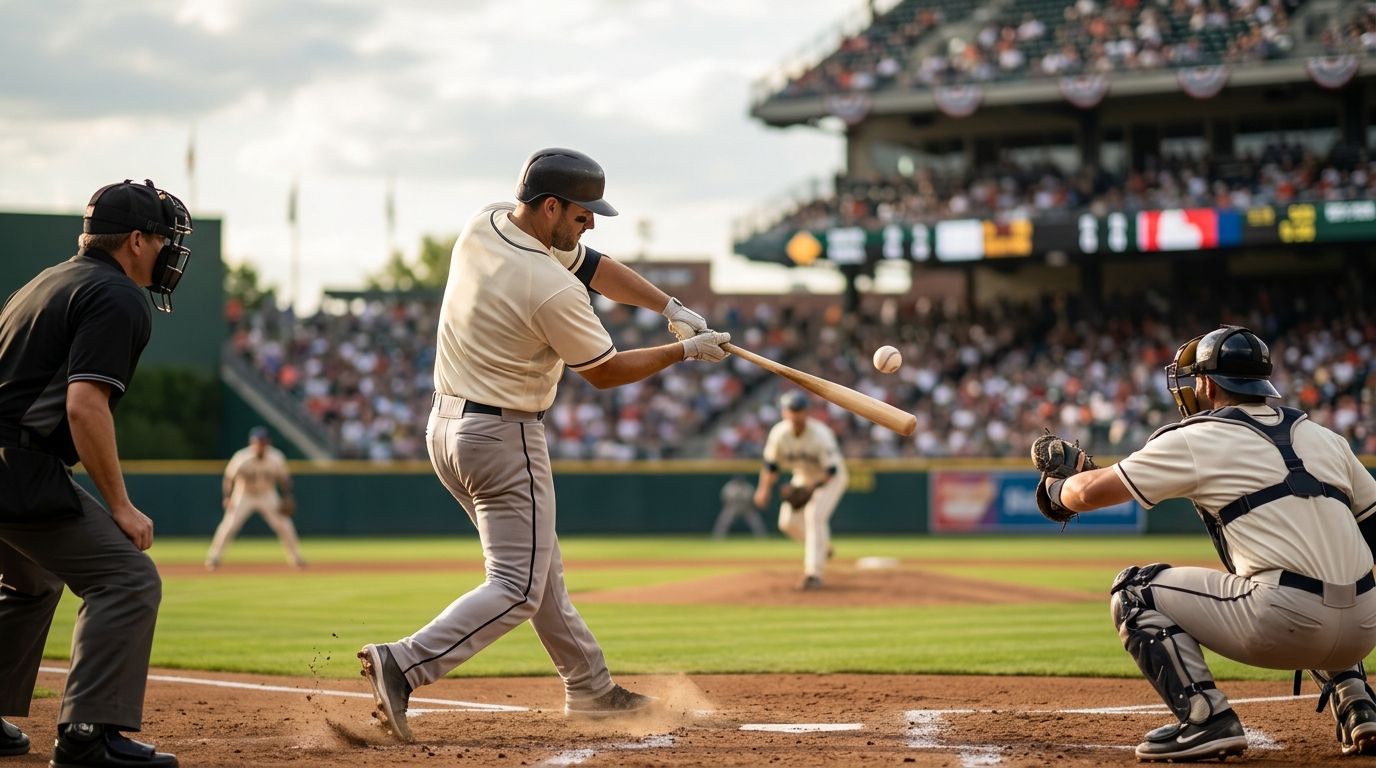
Best overall: OPS for hitters and ERA for starting pitchers. Best for power: home runs. Best for speed: stolen bases. The useful way to read MLB stats leaders in 2026 is to match each leaderboard to the question you are asking. This is a ranking of the categories to follow, not a claim about which players currently lead them.
- For MLB stats leaders in 2026, start with OPS for hitters and ERA for starting pitchers.
- Home runs identify power; stolen bases identify speed; neither tells the whole story of a hitter.
- WHIP shows how often a pitcher allows baserunners, while strikeouts show missed-bat ability.
- Compare playing time and roles before treating any leaderboard position as a player verdict.
Why this matters
A leader can dominate one column and tell you surprisingly little about the next game. A home run total reflects power and opportunity to bat. A stolen-base total depends on reaching base as well as running. A save total says something about a reliever's role; it does not, by itself, identify the best pitcher.
That distinction matters across a 162-game regular season. Early in 2026, a short stretch can move rate-stat rankings sharply; later in 2026, playing time becomes harder to ignore. Sportsorca's MLB analysis is most useful when you read the headline number beside the role, the sample and the matchup rather than treating first place as a complete scouting report.
If a hitter tops the home run list, ask whether the quality of contact supports the power story. Exit velocity and barrel rate for power hitters explains the terms behind that question. Neither measure replaces the home run total; each gives you another way to read it.
What makes an MLB stats leader worth tracking
- A clear job for the statistic. OPS describes hitting production; ERA describes runs charged to a pitcher. Do not ask either to grade an entire roster.
- Enough opportunity to matter. Counting totals reward appearances, plate appearances or innings. Rate statistics can move dramatically when the sample is small.
- The right comparison group. A starter, closer and part-time hitter have different opportunities. Rank players doing comparable jobs.
- A visible limitation. Batting average leaves out walks and extra-base-hit value. Saves depend on a particular game situation.
- A second number that challenges the first. Pair home runs with OPS, ERA with WHIP, and stolen bases with on-base context. If the numbers disagree, investigate before drawing a conclusion.
Those criteria shape the 2026 ranking below. It ranks which leaderboard to open first for each question, not the players on a live leaderboard. No 2026 player names or totals are asserted here.
MLB stats leaders at a glance
| Rank | Category | Best for | Standout signal | Key limitation |
|---|---|---|---|---|
| 1 | OPS | First read on a hitter | Reaching base and hitting for power | Does not include defense or baserunning |
| 2 | ERA | First read on a starter | Earned runs allowed per nine innings | Does not isolate the pitcher from every influence |
| 3 | Home runs | Identifying power | Balls hit out of the park | Playing time affects the total |
| 4 | WHIP | Checking traffic on the bases | Walks and hits allowed per inning | Does not distinguish every kind of contact |
| 5 | Strikeouts | Identifying missed-bat ability | Batters retired on strikes | A total rewards innings pitched |
| 6 | Stolen bases | Identifying running impact | Successful steals | Attempts and times caught matter too |
| 7 | Batting average | Checking hit frequency | Hits divided by at-bats | Excludes walks and extra-base-hit value |
| 8 | Saves | Following late-inning roles | Games finished in save situations | Opportunity depends heavily on role |
The table has a split verdict: OPS and ERA are the best opening tabs, but they answer different questions. In 2026, an impressive rank becomes a useful read only after you check how the player got there. Sportsorca covers MLB for fans and bettors; neither audience gains much from confusing a category lead with a prediction.
1. OPS: best MLB stat for a first read on hitters
OPS adds on-base percentage and slugging percentage. It gives you one quick view of a hitter's ability to reach base and produce extra-base damage. When an unfamiliar name climbs the 2026 hitting leaderboards, OPS is the first category to open because it asks more than whether the player has collected hits.
OPS pros:
- Captures two major parts of offensive production in one familiar figure.
- Makes a useful countercheck when batting average and home run rank tell different stories.
- Helps separate a frequent singles hitter from a hitter doing more damage per opportunity.
OPS cons:
- Leaves out defense and baserunning.
- Does not explain why a hitter's production has changed or whether it will continue.
Best for: Fans comparing overall hitting production. A high OPS calls for a closer look at the hitter; it does not settle a comparison between players with different defensive or running value. Verdict: Buy as the first batting signal; hold on any all-around-player claim.
2. ERA: best MLB stat for a first read on starters
ERA expresses a pitcher's earned runs allowed per nine innings. For a starting pitcher, it answers the blunt question fans ask after a run of starts: how many earned runs are crossing the plate? That makes it the cleanest opening tab for run prevention, not the last word on pitching ability.
ERA pros:
- Connects directly to runs allowed, the result that matters on the scoreboard.
- Works as an accessible starting point before you examine baserunners or strikeouts.
- Lets you spot when a starter's results differ from another starter's results.
ERA cons:
- Earned-run scoring does not account for every influence on the result.
- A small number of innings can make an early 2026 ranking unstable.
Best for: Fans checking a starter's run-prevention results. Read ERA beside WHIP and strikeouts before calling a pitcher dominant. Verdict: Buy for the first read; hold on a prediction drawn from ERA alone.
3. Home runs: best MLB stat for the power race
The home run leaderboard needs little translation. It counts the clearest form of power production, and a change near the top of that list makes an immediate baseball story. But the hitter with the most home runs is not automatically the hitter producing the most complete offensive season.
Home run pros:
- Counts a decisive result rather than an inferred measure of power.
- Makes a power race easy to follow across the 2026 season.
- Gives you a clear starting point for examining a hitter's extra-base production.
Home run cons:
- More chances to bat create more chances to add to the total.
- The total does not tell you how often the hitter reaches base or strikes out.
Best for: Fans following home run races and comparing power hitters. Put OPS next to the total: if the categories tell different stories, that disagreement is more interesting than either rank alone. Verdict: Buy for power; hold as a complete hitting grade.
4. WHIP: best MLB stat for checking baserunner traffic
WHIP combines walks and hits allowed, then divides by innings pitched. ERA tells you about earned runs; WHIP tells you how often a pitcher lets runners aboard through those two routes. When the two leaderboards disagree, you have a reason to look more closely at a pitcher's starts rather than choose the prettier rank.
WHIP pros:
- Adds baserunner context to an ERA-led pitching comparison.
- Includes walks, which a hits-only glance misses.
- Applies to pitchers whose jobs differ, provided you account for those roles.
WHIP cons:
- Treats every hit alike within the calculation.
- Does not tell you whether baserunners scored or how a pitcher escaped trouble.
Best for: Fans testing whether a strong ERA comes with limited traffic. In 2026, WHIP is the second tab to open on a pitcher, not a substitute for watching the pitcher's role and innings. Verdict: Buy as an ERA check; hold as a standalone verdict.
5. Strikeouts: best MLB stat for missed-bat ability
A strikeout ends a plate appearance without a ball put in play. The season total highlights pitchers piling up those outs, which makes it compelling in an ace race. It also rewards time on the mound: a pitcher who works more innings has more chances to climb a counting leaderboard.
Strikeout pros:
- Records a concrete pitching outcome.
- Helps distinguish a pitcher missing bats from one whose outs come mainly on balls in play.
- Adds a different angle when two pitchers have similar ERA figures.
Strikeout cons:
- A total mixes ability with innings pitched.
- Strikeouts alone do not show walks, hits allowed or runs prevented.
Best for: Fans comparing missed-bat production, especially among starters with similar workloads. Check innings before treating the 2026 strikeout leader as the most effective pitcher. Verdict: Buy for missed bats; hold as a complete pitching grade.
6. Stolen bases: best MLB stat for the speed race
A stolen base shows a runner advancing without a hit, error or other play that would account for the advance. The leaderboard makes speed visible. Yet speed alone does not produce a stolen base: the player first needs an opportunity to run, and the success total leaves out attempts that ended with an out.
Stolen-base pros:
- Counts successful advances rather than merely describing a player as fast.
- Identifies runners changing their position on the bases.
- Adds a dimension that OPS and home runs do not capture.
Stolen-base cons:
- The total does not show how often a player was caught stealing.
- Opportunity affects how often a runner can attempt a steal.
Best for: Fans tracking running impact in 2026. Read successes beside attempts and times caught, then look at how often the player reaches base. Verdict: Buy for the speed race; hold before calling the runner efficient.
7. Batting average: best MLB stat for hit frequency
Batting average divides hits by at-bats. It answers a narrow question cleanly: how often does a hitter get a hit in an official at-bat? That still matters. Trouble starts when a batting-title race gets treated as a complete account of offensive value.
Batting-average pros:
- Easy to connect to a familiar game outcome: a hit.
- Useful for comparing hit frequency among eligible hitters.
- Provides a contrast when a hitter's OPS points to a different offensive story.
Batting-average cons:
- Walks are not hits and do not raise batting average.
- A single and a home run each count as one hit in the calculation.
Best for: Fans following the batting-title race or checking hit frequency. In 2026, open OPS alongside batting average before describing who has had the stronger offensive season. Verdict: Buy for hit frequency; skip it as the only batting measure.
8. Saves: best MLB stat for following closer roles
Saves track a specific relief-pitching result in qualifying situations. That gives the leaderboard a clear narrative: which pitchers are finishing games with a lead under save conditions? It does not mean the leader is the league's best reliever. A pitcher cannot collect a save without the right game situation and assignment.
Saves pros:
- Shows who has converted qualifying late-game opportunities.
- Helps fans identify established finishing roles.
- Gives context to a club's late-inning story.
Saves cons:
- Team opportunities and managerial decisions shape the total.
- The count does not measure every valuable relief appearance.
Best for: Fans tracking closers and late-inning assignments. Pair saves with WHIP, strikeouts and role context before comparing relief pitchers in 2026. Verdict: Hold as a pitcher ranking; buy as a role tracker.
How these categories are ranked
This order puts the broadest first-read measures ahead of narrower counting categories. OPS opens the hitting conversation; ERA opens the starting-pitching conversation. Home runs, WHIP and strikeouts sharpen those reads. Stolen bases, batting average and saves answer more specific questions, but each has a clear blind spot if you use it to crown an overall leader.
That is a ranking of usefulness for reading MLB stats leaders, not a live ranking of players. It does not identify a current 2026 leader or claim that one statistic predicts the next game's result. To compare two players, start with the measure that fits their roles, then check the measure most likely to challenge your first impression.
Which MLB stats leaders should you follow first?
If you have one minute, open OPS for hitters and ERA for starting pitchers. Follow home runs when the question is power, stolen bases when it is running, and saves when it is the closer's role. For a pitcher whose ERA catches your eye, check WHIP and strikeouts before you decide what the run total means.
Sportsorca is best for fans who want MLB stats leaders placed in game context rather than treated as a frozen player leaderboard. In a 2026 matchup, the category leader is the beginning of the question. The opposing lineup, the player's role and the opportunity behind the number determine what you should examine next.
FAQ
What are the best MLB stats leaders to check first in 2026?
Check OPS for hitters and ERA for starting pitchers first. Then use home runs, WHIP, strikeouts or stolen bases to answer a more specific question.
Is the home run leader the best hitter in MLB?
No. Home runs identify power production, while OPS also accounts for reaching base and extra-base hitting. Defense and baserunning require separate consideration.
Is ERA better than WHIP for judging a pitcher?
ERA is the better first read on earned runs allowed; WHIP adds the walks-and-hits context. Use both before drawing a conclusion about a starter.
Why can an MLB strikeout leader rank below another pitcher?
A strikeout total reflects missed-bat production and time on the mound. ERA, WHIP and innings add context that the total cannot supply alone.
Does batting average include walks?
No. Batting average divides hits by at-bats; walks do not count as hits. Check OPS when you also want a measure that includes on-base production.
Does the saves leader have to be the best reliever?
No. Saves depend on qualifying opportunities and late-inning assignments. Check a reliever's other pitching numbers and role before comparing performance.
Who currently leads every MLB stat category in 2026?
This guide does not identify current 2026 player leaders. It ranks the categories to check and explains what each leaderboard can and cannot tell you.
One last thing
A leaderboard can change your question instead of answering it. If the ERA leader allows more baserunners than another starter, WHIP exposes the contrast; if a home run leader trails another hitter in OPS, the power race and the overall batting read are telling different stories. Follow the disagreement. That is where a 2026 game preview becomes more useful than a list of names.